Power Augmentation Problem
A customer of mine owns a combined-cycle power plant that runs well most of the time, but when they start up or shut down the power augmentation system, the latter oscillates wildly. They have already tried to retune the relevant controllers, but with no success.
Power augmentation is done by injecting water or steam into the combustion chambers of a gas turbine to increase power output and/or reduce NOx emissions. This plant uses steam from the heat-recovery steam generator (HRSG) for power augmentation. Because the steam from the HRSG is superheated, it needs to be attemperated (its temperature lowered) before being injected into the combustion chambers.
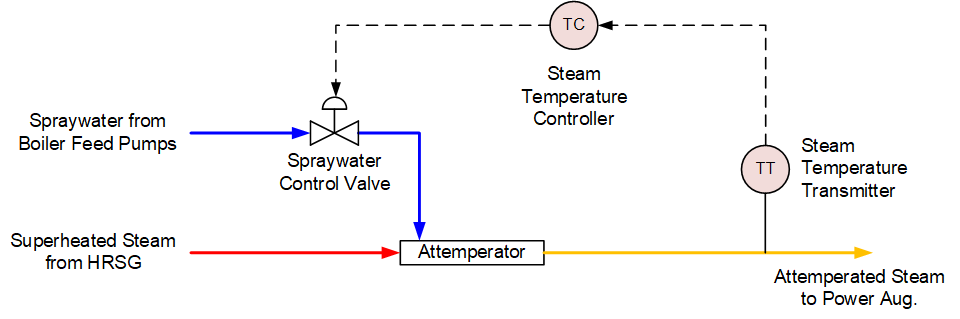
The steam is attemperated by spraying demineralized water into it using a device called an attemperator. The attemperator’s outlet temperature is controlled to 680°F (360°C) by modulating the flowrate of the spraywater with a control valve as shown in Figure 1.
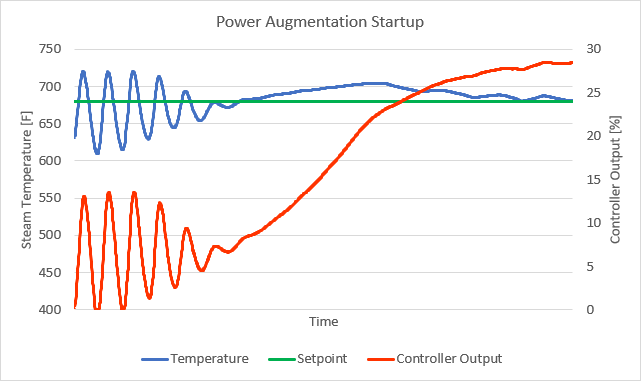
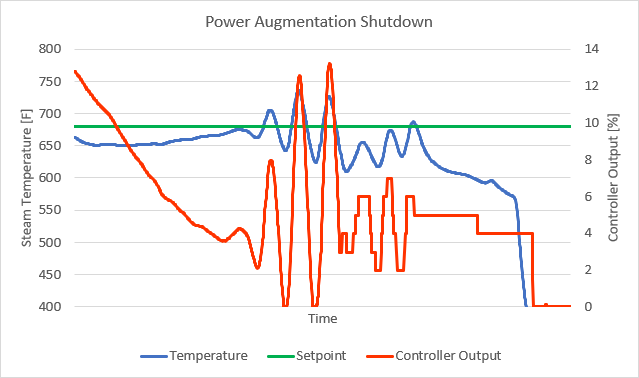
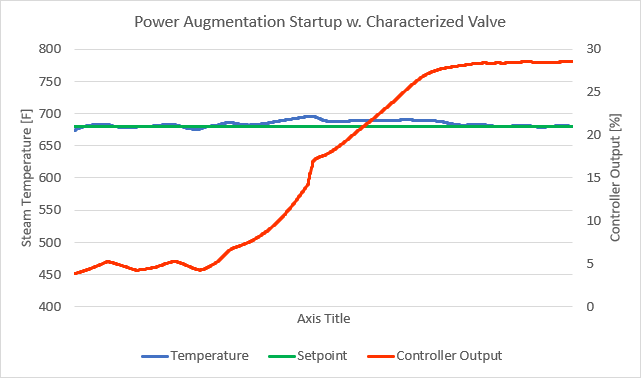
I was called to site to witness the startup and shutdown of the power augmentation system to help analyze and solve the problem. Just as they told me, the steam temperature, spraywater flow rate, and augmentation steam flow rate started oscillating during startup and shutdown of power augmentation. The oscillations only occurred when the spraywater control valve was less than 10% open (Figure 2 and Figure 3), which raised the suspicion that the control valve’s flow characteristic curve might not be linear.
To analyze the control valve’s linearity, we recorded a few data points of control valve position and the corresponding flow rate through the valve from the process historian. We tried to use only steady state data, which was difficult to find, because the control loop oscillated at low flows. Luckily, the operators often intervened by putting the loop in manual when the control loop oscillated – thereby providing the steady-state control valve position and flow-rate data we were looking for.
We typed the data into Excel, and sorted it in ascending order on control valve position. For interest, we also calculated the gain for each change in valve position. (Gain was calculated by dividing the change in flow rate by the change in valve position.), The gain changed from almost 7 at the low operating end to 0.5 at the high operating end. That is a change in gain by more than a factor of 13! PID control loops cannot handle such vast changes in process gain at all.
| Valve Position [%] | Flow Rate [GPM] | Valve Gain |
| 1.6 | 0.3 | N/A |
| 2 | 3 | 6.75 |
| 4.5 | 13.3 | 4.12 |
| 6.1 | 17.2 | 2.44 |
| 12.4 | 23.2 | 0.95 |
| 13.1 | 23.7 | 0.71 |
| 16.9 | 25.2 | 0.39 |
| 20 | 26.2 | 0.32 |
| 23 | 27.2 | 0.33 |
| 26.1 | 28.2 | 0.32 |
| 28.1 | 29.2 | 0.5 |
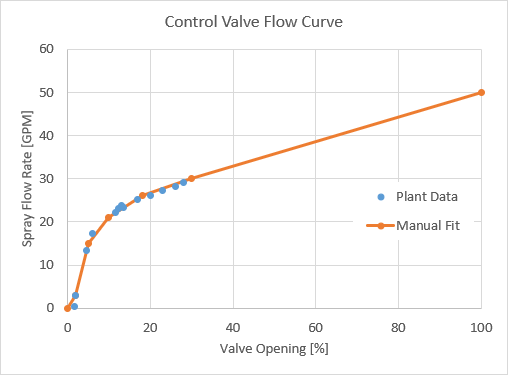
We also plotted the flow rate versus control valve position data in Excel, and manually fitted a curve to the data that we would use later when designing the valve characterizer (or linearizer). We carefully positioned the points for the manual fit to obtain a reasonably smooth curve. The results are shown in Figure 4. You will notice that we extrapolated the data quite some way above the maximum normal operating point to get an estimated flow for 100% control valve position. This is good practice and it is done to ensure the characterizer (linearizer) will cover more than the normal operating range, in case this is needed at some point.
To design the characterizer (linearizer) we took the manually-fitted curve, added a (0; 0) point, and normalized the flow rate to obtain a 100% flow corresponding with a 100% control valve position. Normalization is done by dividing all the flow rates by the value of the largest flow rate (50 in this case), and multiplying the result by 100%.
Table 2. Manually fitted flow curve, and normalized flow rate.
| Vale Position [%] | Flow Rate [GPM] | Normalized Flow [%] |
| 0 | 0 | 0 |
| 2 | 3 | 6 |
| 5 | 15 | 30 |
| 10 | 21 | 42 |
| 18 | 26 | 52 |
| 30 | 30 | 60 |
| 100 | 50 | 100 |
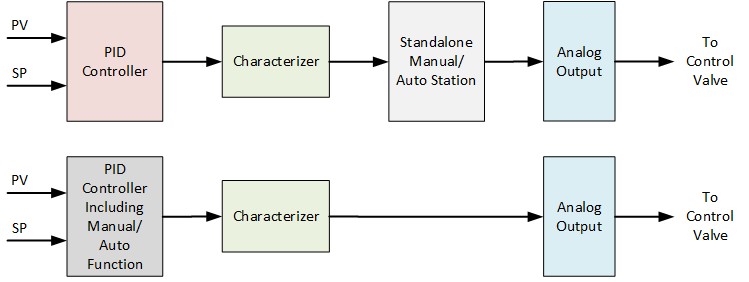
We then implemented the characterizer in the control system, between the controller and the Manual/Auto Station. Note that some control systems have its Manual/Auto function included in the PID block. In that case, the characterizer has to be installed between the PID block and the analog output to the control valve, as shown at the top in Figure 5. The difference is that with the top option in Figure 5, the control valve position should always match the value in the Manual/Auto Station’s output, while in the bottom option, it will not. The latter (bottom option) makes control valve stroke testing much more difficult because of the mismatch.
The characterizer is simply a function generator loaded with the normalized flow rate values as X-values, and the valve position values and Y-values, as shown in Table 3.
| X-Values | Y-values |
| 0 | 0 |
| 6 | 2 |
| 30 | 5 |
| 42 | 10 |
| 52 | 18 |
| 60 | 30 |
| 100 | 100 |
After characterizing the control valve, we also did a few step tests and retuned the controller using the Cohen-Coon tuning method. You should always retune a controller after characterizing a control valve. After characterization and tuning, we retested the system and there were no more oscillations (Figure 6).
The bottom line? It’s not all about tuning. Tuning certainly plays a major role in control loop performance, but you have to look at the entire control loop, which includes the final control element (spraywater control valve in this case), process, measurement, and of course the controller tuning.
Stay Tuned
Jacques Smuts, Founder and Principal Consultant of OptiControls
Author of Process Control for Practitioners

Hello Jacques,
what would be the ideal process gain that PID controllers can handle successfully?
This question came up while reading through “…..That is a change in gain by more than a factor of 13! PID control loops cannot handle such vast changes in process gain at all….”
Prasad: It depends on how “tightly” the controller is tuned. Tuning for quarter-amplitude damping can tolerate almost no change in process gain. Tuning methods recommended in this blog (e.g. https://blog.opticontrols.com/archives/383) “detunes” the controller by a factor of 2 which will tolerate a 2x change in process gain.
I would like to thank you for all the practical advices. You had previously responded to my question regarding the error squared control. I owed you a thank you note. If you come to Houston, let me know. I will buy you a beer.
Thanks Tesh – I am located in Houston. Not too far from your plant.